
Note
Click here to download the full example code
3.1.6.1. Boxplots and paired differences
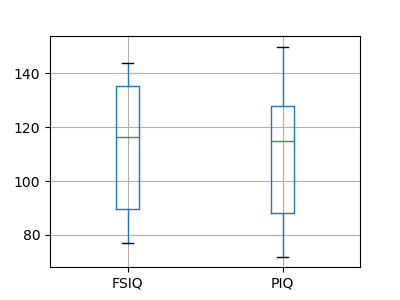
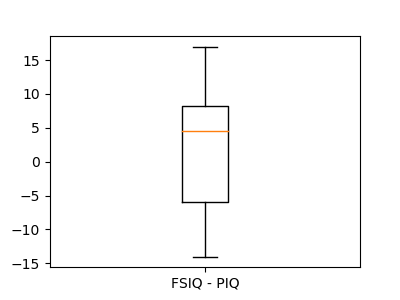
Plot boxplots for FSIQ, PIQ, and the paired difference between the two: while the spread (error bars) for FSIQ and PIQ are very large, there is a systematic (common) effect due to the subjects. This effect is cancelled out in the difference and the spread of the difference (“paired” by subject) is much smaller than the spread of the individual measures.
import pandas

import matplotlib.pyplot as plt

data = pandas.read_csv('brain_size.csv', sep=';', na_values='.')

# Box plot of FSIQ and PIQ (different measures od IQ)
plt.figure(figsize=(4, 3))
data.boxplot(column=['FSIQ', 'PIQ'])

# Boxplot of the difference
plt.figure(figsize=(4, 3))
plt.boxplot(data['FSIQ'] - data['PIQ'])
plt.xticks((1, ), ('FSIQ - PIQ', ))

plt.show()
Total running time of the script: ( 0 minutes 0.053 seconds)