
Note
Click here to download the full example code
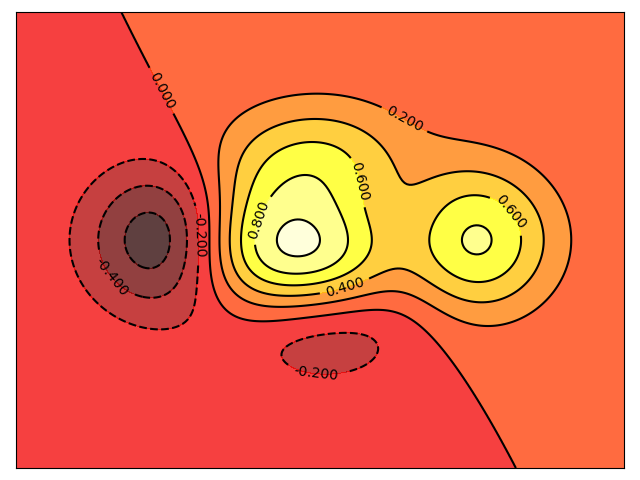
Displaying the contours of a function
An example showing how to display the contours of a function with matplotlib.
import numpy as np
import matplotlib.pyplot as plt

def f(x,y):
    return (1 - x / 2 + x**5 + y**3) * np.exp(-x**2 -y**2)

n = 256
x = np.linspace(-3, 3, n)
y = np.linspace(-3, 3, n)
X,Y = np.meshgrid(x, y)

plt.axes([0.025, 0.025, 0.95, 0.95])

plt.contourf(X, Y, f(X, Y), 8, alpha=.75, cmap=plt.cm.hot)
C = plt.contour(X, Y, f(X, Y), 8, colors='black', linewidth=.5)
plt.clabel(C, inline=1, fontsize=10)

plt.xticks([])
plt.yticks([])
plt.show()
Total running time of the script: ( 0 minutes 0.063 seconds)