
Note
Click here to download the full example code
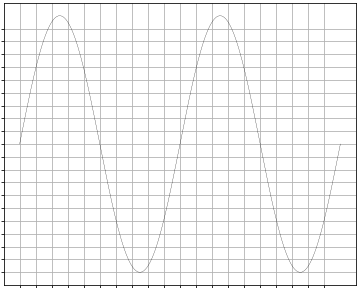
A simple plotting example
A plotting example with a few simple tweaks
import numpy as np
import matplotlib
matplotlib.use('Agg')
import matplotlib.pyplot as plt

fig = plt.figure(figsize=(5, 4), dpi=72)
axes = fig.add_axes([0.01, 0.01, .98, 0.98])
x = np.linspace(0, 2, 200)
y = np.sin(2 * np.pi * x)
plt.plot(x, y, lw=.25, c='k')
plt.xticks(np.arange(0.0, 2.0, 0.1))
plt.yticks(np.arange(-1.0, 1.0, 0.1))
plt.grid()
plt.show()
Total running time of the script: ( 0 minutes 0.035 seconds)