
Note
Click here to download the full example code
2.6.8.24. Segmentation with spectral clustering
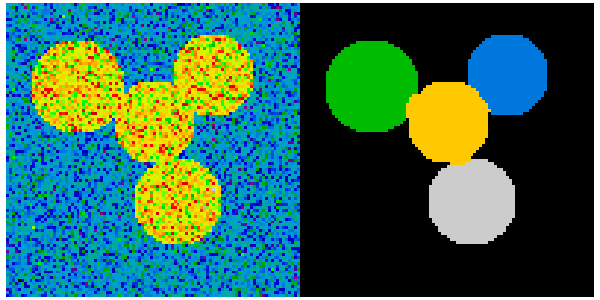
This example uses spectral clustering to do segmentation.
import numpy as np
import matplotlib.pyplot as plt

from sklearn.feature_extraction import image
from sklearn.cluster import spectral_clustering
l = 100
x, y = np.indices((l, l))

center1 = (28, 24)
center2 = (40, 50)
center3 = (67, 58)
center4 = (24, 70)

radius1, radius2, radius3, radius4 = 16, 14, 15, 14

circle1 = (x - center1[0])**2 + (y - center1[1])**2 < radius1**2
circle2 = (x - center2[0])**2 + (y - center2[1])**2 < radius2**2
circle3 = (x - center3[0])**2 + (y - center3[1])**2 < radius3**2
circle4 = (x - center4[0])**2 + (y - center4[1])**2 < radius4**2
4 circles
img = circle1 + circle2 + circle3 + circle4
mask = img.astype(bool)
img = img.astype(float)

img += 1 + 0.2*np.random.randn(*img.shape)

# Convert the image into a graph with the value of the gradient on the
# edges.
graph = image.img_to_graph(img, mask=mask)

# Take a decreasing function of the gradient: we take it weakly
# dependant from the gradient the segmentation is close to a voronoi
graph.data = np.exp(-graph.data / graph.data.std())

# Force the solver to be arpack, since amg is numerically
# unstable on this example
labels = spectral_clustering(graph, n_clusters=4)
label_im = -np.ones(mask.shape)
label_im[mask] = labels

plt.figure(figsize=(6, 3))
plt.subplot(121)
plt.imshow(img, cmap=plt.cm.nipy_spectral, interpolation='nearest')
plt.axis('off')
plt.subplot(122)
plt.imshow(label_im, cmap=plt.cm.nipy_spectral, interpolation='nearest')
plt.axis('off')

plt.subplots_adjust(wspace=0, hspace=0., top=0.99, bottom=0.01, left=0.01, right=0.99)
plt.show()
Total running time of the script: ( 0 minutes 0.241 seconds)